We are excited to announce you that the new Horizon Threat Intelligence Platform has been released! The new version includes a complete redesign of the user interface and plenty of new features!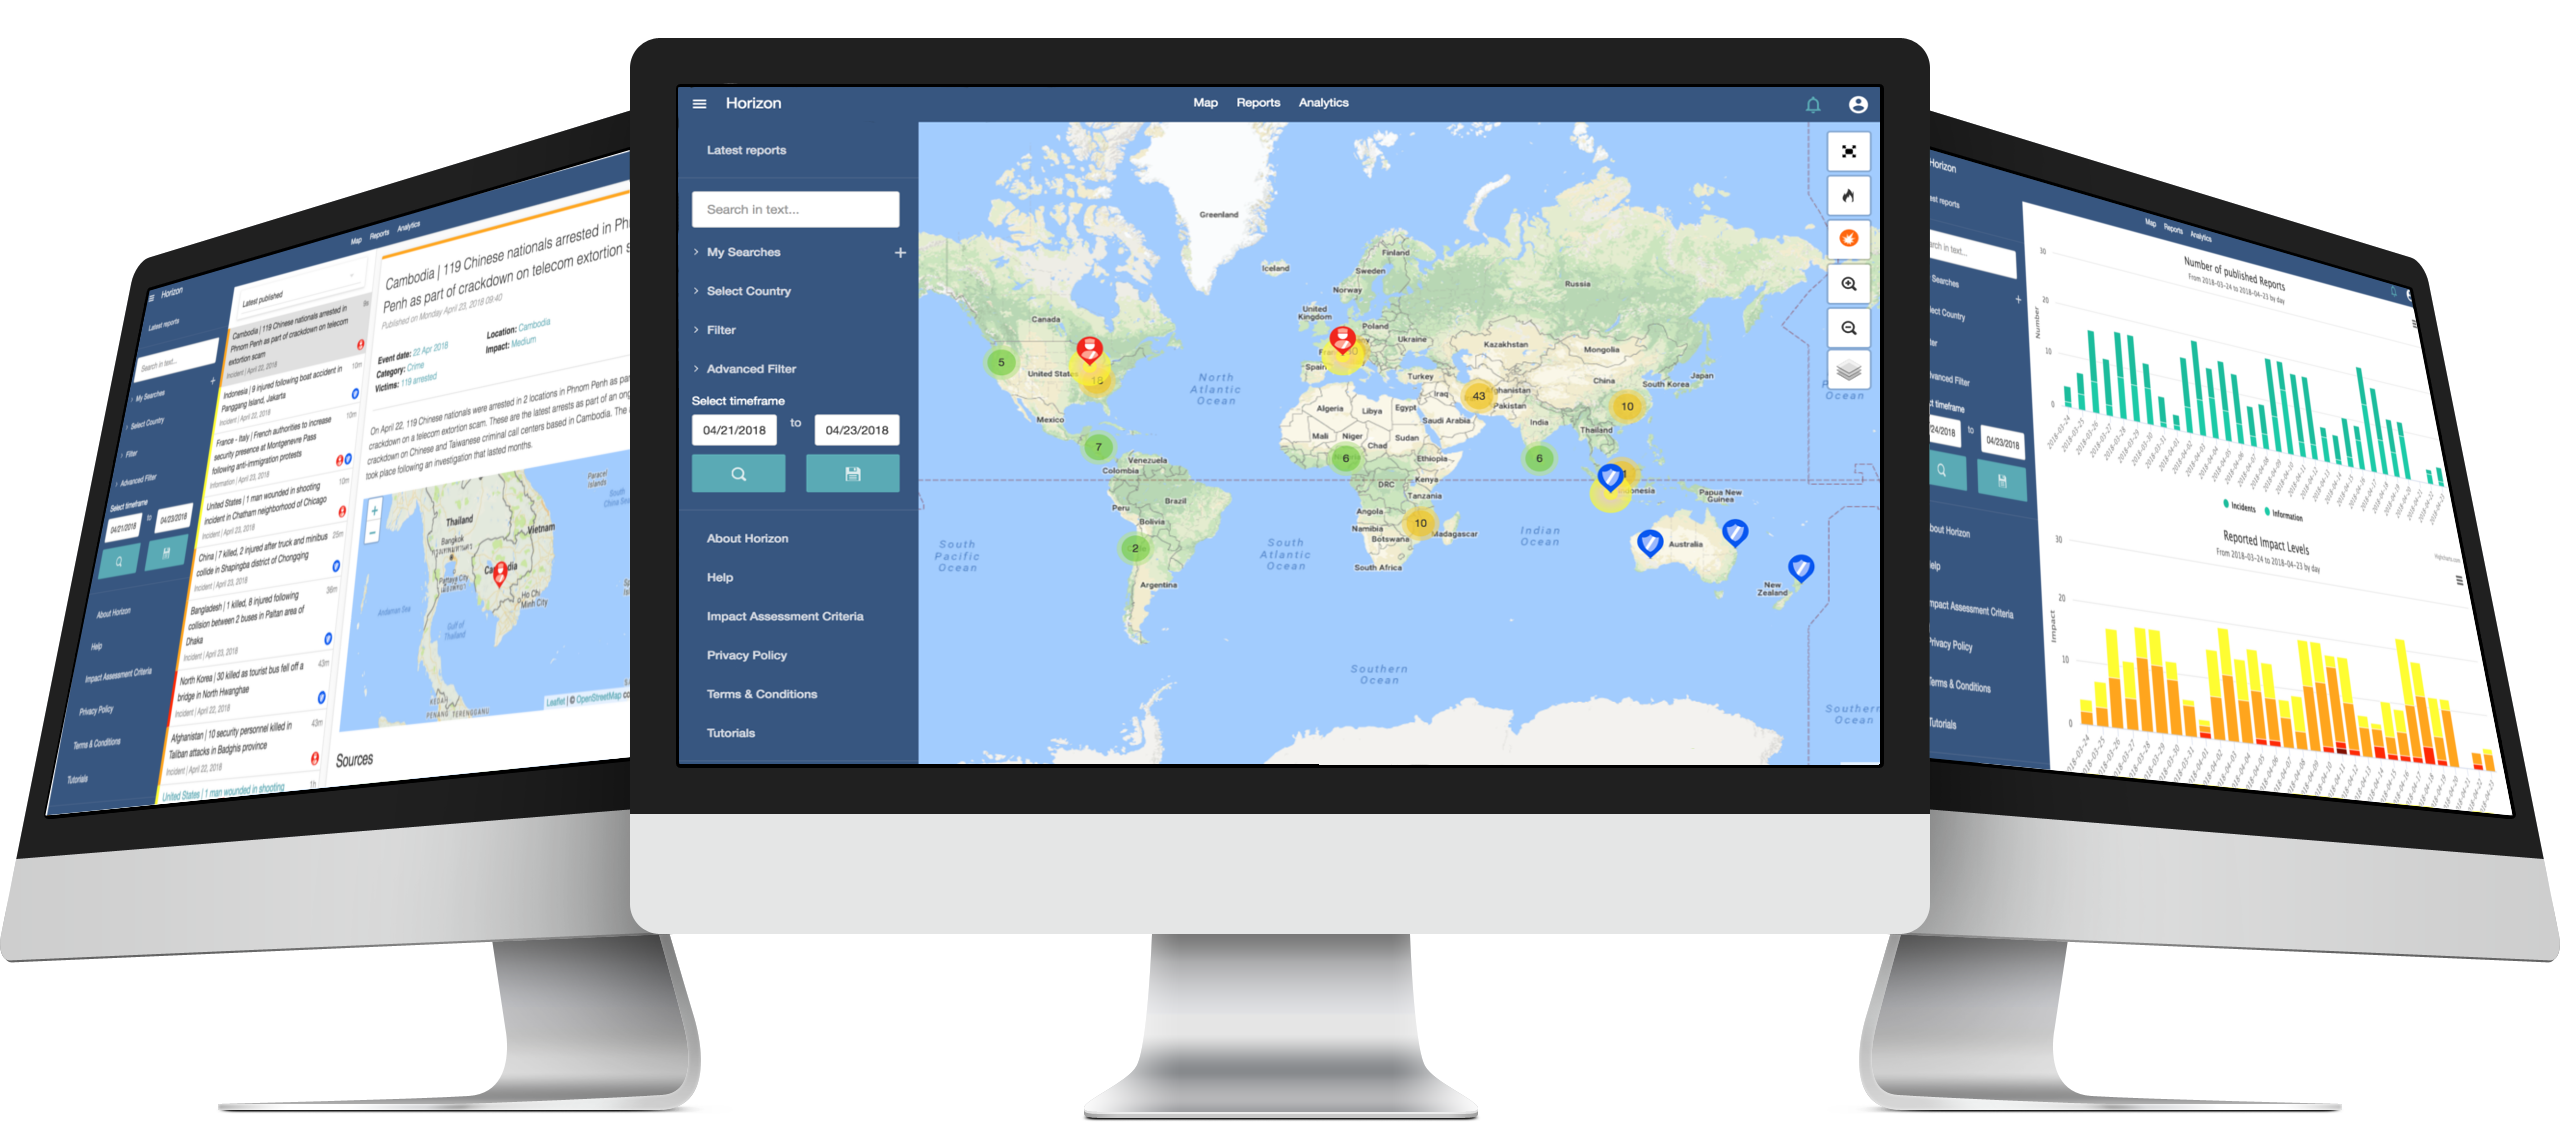
[su_button url=”https://www.hozint.com/horizon/demo/” target=”blank” style=”flat” background=”#5aaab5″ size=”13″ center=”yes” radius=”0″]Request a demo[/su_button]
What’s new?
The new look has been designed to optimize the user’s experience with the platform and to integrate new features, such as:
-
New advanced map visualisation options for qualitative and quantitative geographical analysis (more below);
-
New analytic tools to easily turn data into insights and discover new trends (more below);
-
Improved visualization of reports with the list and preview now on the same page (more below);
New advanced mapping
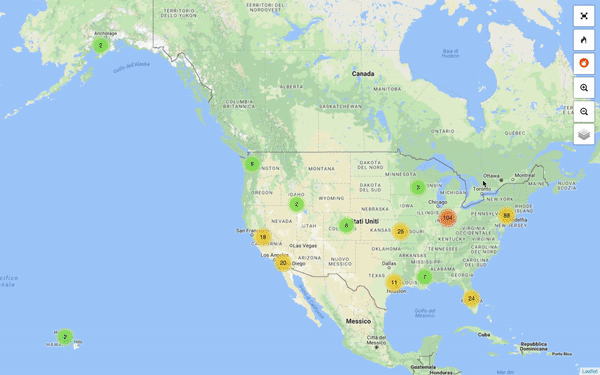
The new interactive map offers 3 different options to visualise reports:
-
Report view: shows reports in the form of clustered or individual markers representing the category of the event (e.g. security, safety, travel warning, etc.);
-
Impact view: shows reports in the form of coloured dots representing the qualitative impact assessment of the single report (red = high / yellow = low);
-
Heatmap: shows the relative number of reports for a given location;
Integrated data analytics
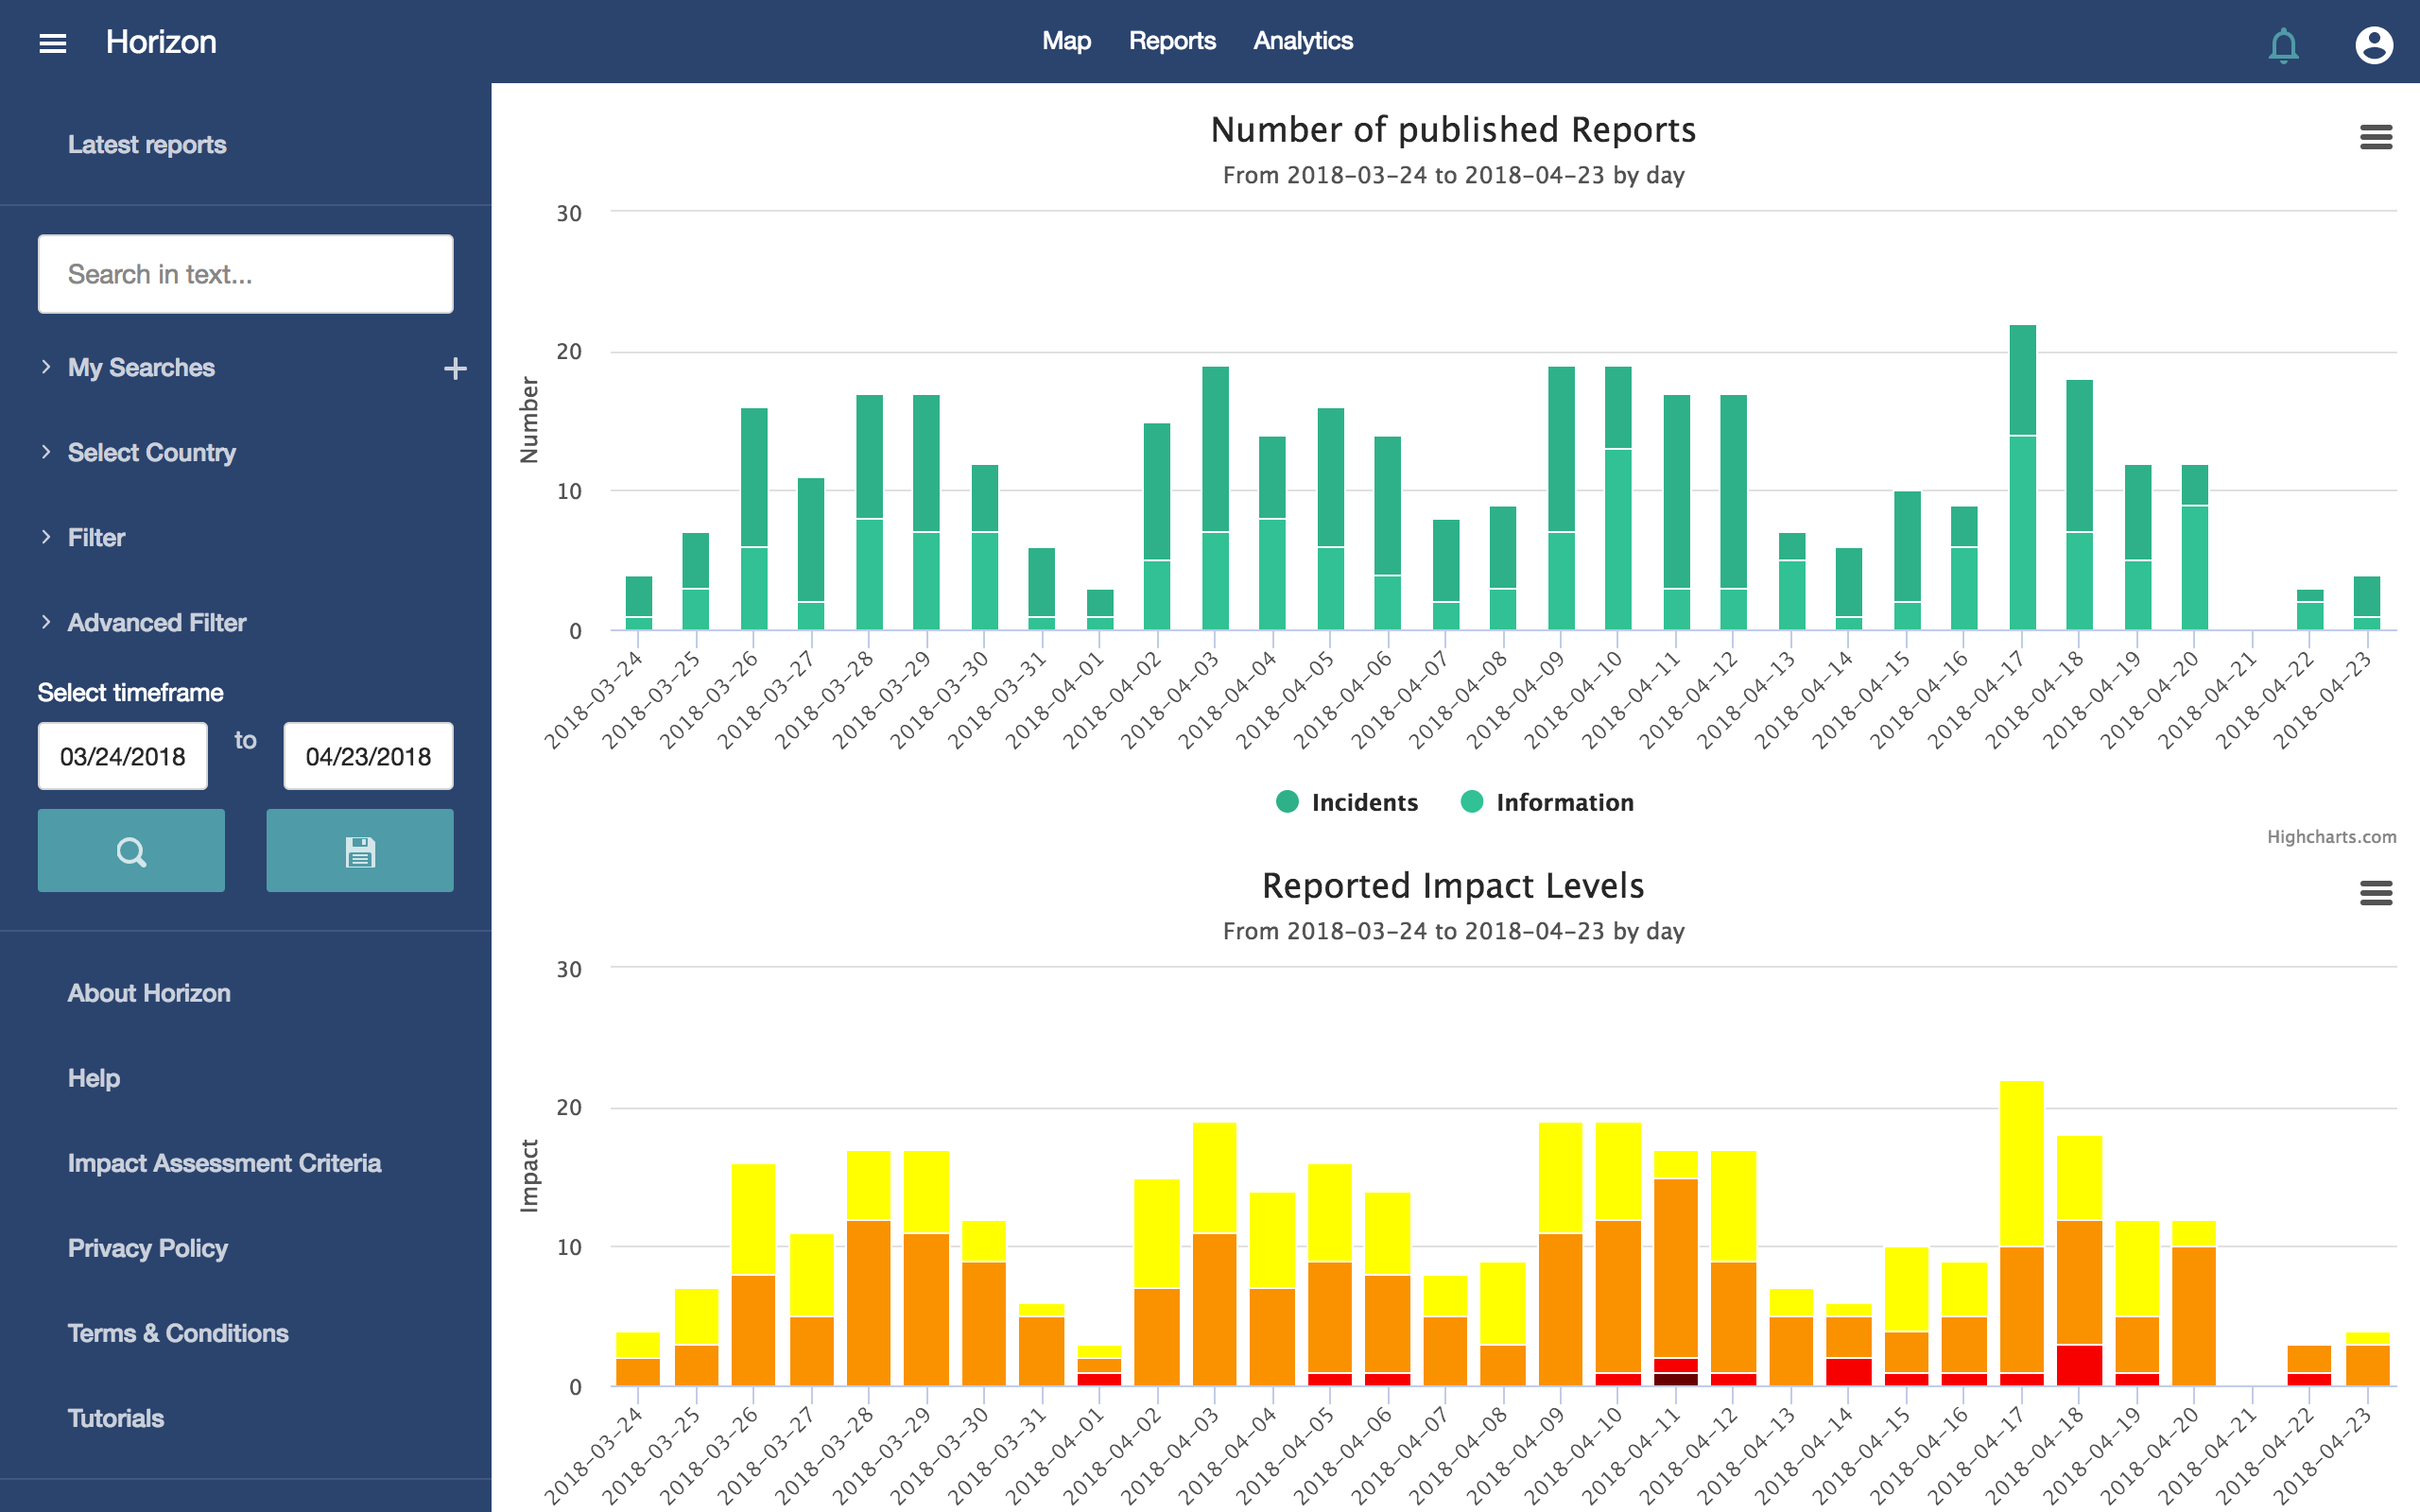
The new analytic tool allows you to display data with interactive charts to easily get insights and discover new trends. The available charts are:
-
Number of reports: it displays the number of incident/information published over a selected timeframe;
-
Impact level: it displays the number of reports by their qualitative impact assessment (low, medium, high, extreme);
-
Victims: it displays the number of victims in the selected period (e.g. dead, wounded, arrested, missing, hostages);
-
Categories: it displays the number of reports by category (e.g. security, safety, politics, etc.);
-
Topics: it displays the number of report by sub-category (e.g. terrorism, crime, civil unrest, natural disaster, etc.);
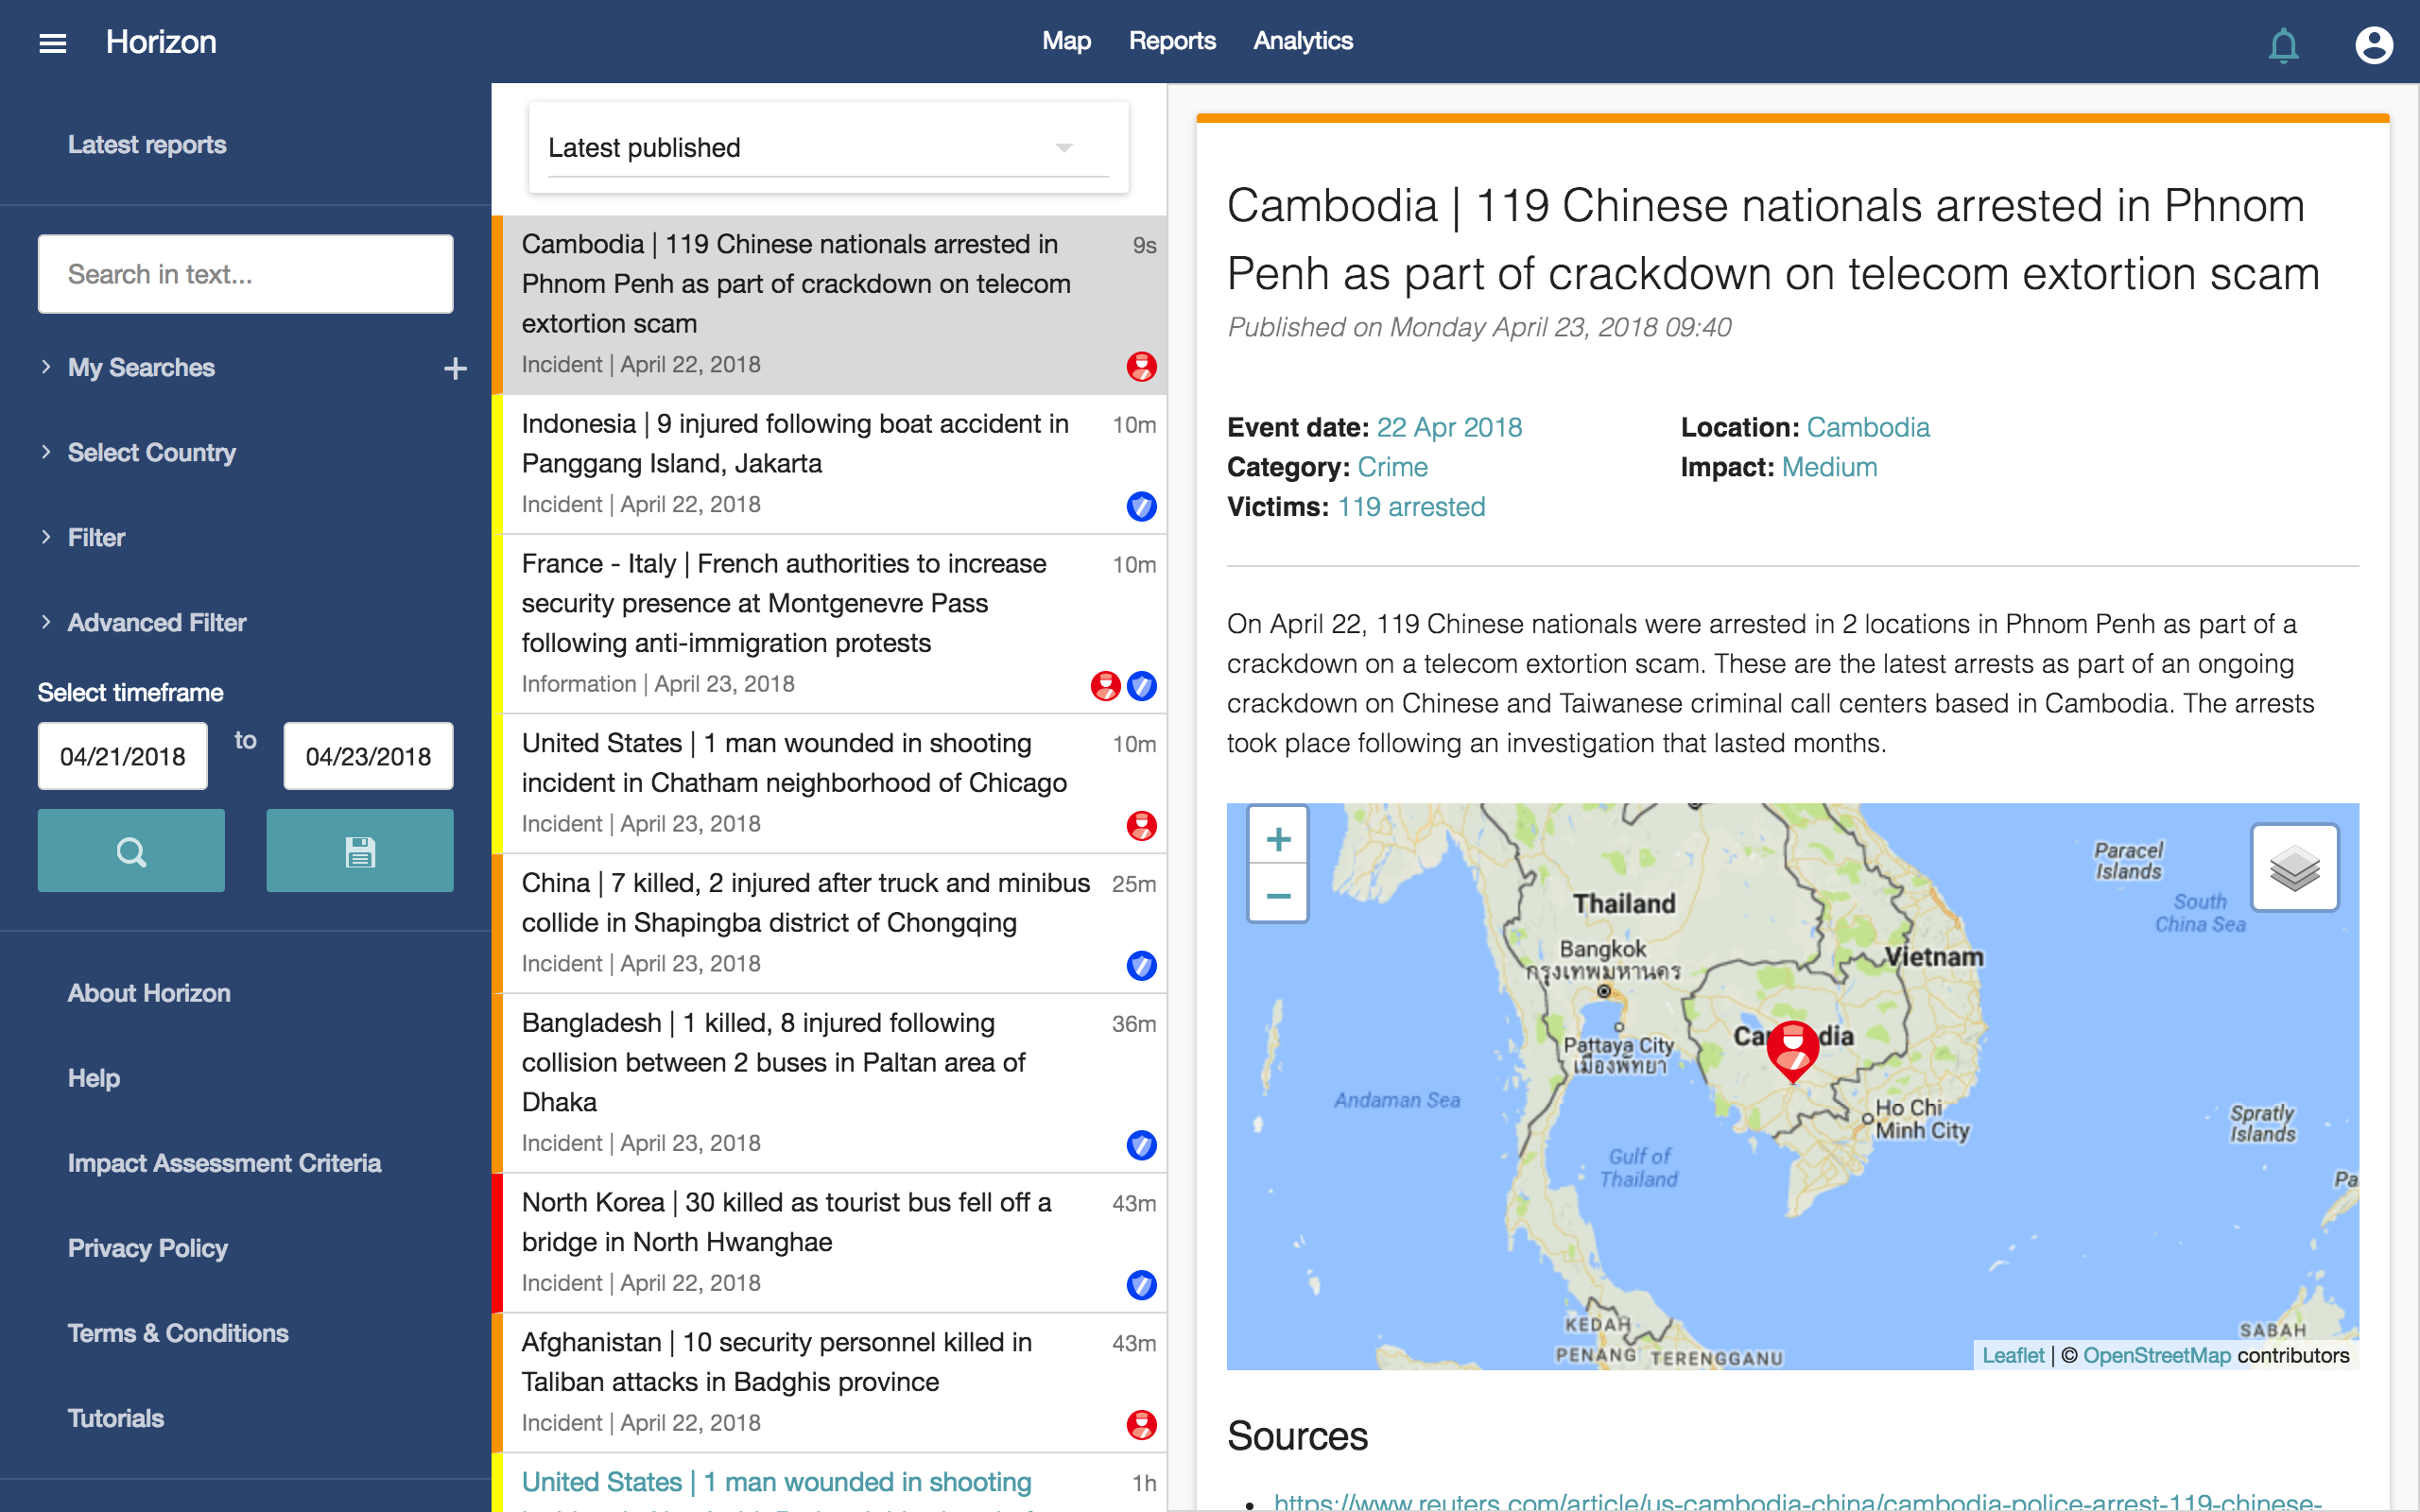
New report view
The list and reports are now in a separate tab, hence allowing you to visualise all information at once.
Do you want to see it in action?
[su_button url=”https://www.hozint.com/horizon/demo/” target=”blank” style=”flat” background=”#5aaab5″ size=”13″ center=”yes” radius=”0″]Request a demo[/su_button]